|
Download Data (XLS File) |
|
|||||
|
|||||
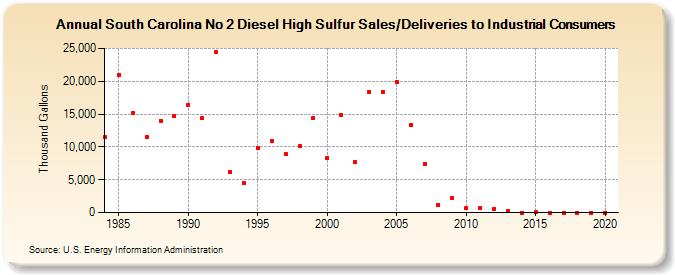
| South Carolina No 2 Diesel High Sulfur Sales/Deliveries to Industrial Consumers (Thousand Gallons) | |||||
| Decade | Year-0 | Year-1 | Year-2 | Year-3 | Year-4 | Year-5 | Year-6 | Year-7 | Year-8 | Year-9 |
|---|---|---|---|---|---|---|---|---|---|---|
| 1980's | 11,508 | 20,982 | 15,172 | 11,574 | 13,983 | 14,707 | ||||
| 1990's | 16,347 | 14,337 | 24,401 | 6,165 | 4,558 | 9,836 | 10,942 | 8,845 | 10,166 | 14,472 |
| 2000's | 8,379 | 14,876 | 7,678 | 18,288 | 18,296 | 19,909 | 13,395 | 7,448 | 1,154 | 2,206 |
| 2010's | 711 | 683 | 589 | 303 | 0 | 67 | 0 | 0 | 0 | 0 |
| 2020's | 0 |
| - = No Data Reported; -- = Not Applicable; NA = Not Available; W = Withheld to avoid disclosure of individual company data. |
| Release Date: 2/9/2022 |
| Next Release Date: Suspended |