|
Download Data (XLS File) |
|
|||||
|
|||||
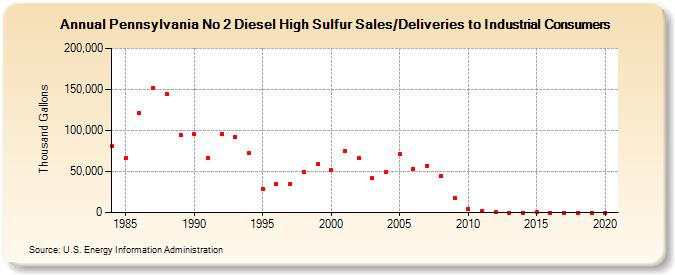
| Pennsylvania No 2 Diesel High Sulfur Sales/Deliveries to Industrial Consumers (Thousand Gallons) | |||||
| Decade | Year-0 | Year-1 | Year-2 | Year-3 | Year-4 | Year-5 | Year-6 | Year-7 | Year-8 | Year-9 |
|---|---|---|---|---|---|---|---|---|---|---|
| 1980's | 80,555 | 66,593 | 121,310 | 152,049 | 144,533 | 94,350 | ||||
| 1990's | 95,135 | 66,734 | 95,773 | 91,598 | 71,976 | 28,853 | 34,576 | 34,437 | 49,147 | 58,709 |
| 2000's | 51,492 | 75,185 | 65,867 | 41,691 | 49,403 | 71,448 | 52,897 | 56,493 | 44,054 | 18,090 |
| 2010's | 4,656 | 1,739 | 114 | 53 | 0 | 86 | 0 | 0 | 0 | 0 |
| 2020's | 0 |
| - = No Data Reported; -- = Not Applicable; NA = Not Available; W = Withheld to avoid disclosure of individual company data. |
| Release Date: 2/9/2022 |
| Next Release Date: Suspended |