|
Download Data (XLS File) |
|
|||||
|
|||||
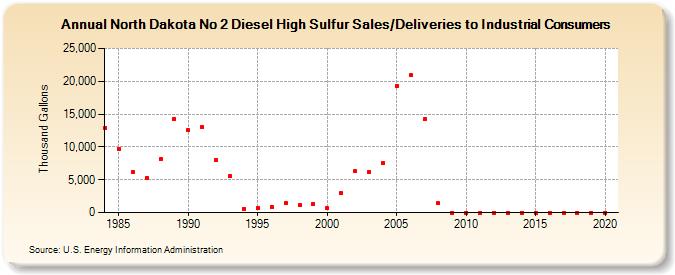
| North Dakota No 2 Diesel High Sulfur Sales/Deliveries to Industrial Consumers (Thousand Gallons) | |||||
| Decade | Year-0 | Year-1 | Year-2 | Year-3 | Year-4 | Year-5 | Year-6 | Year-7 | Year-8 | Year-9 |
|---|---|---|---|---|---|---|---|---|---|---|
| 1980's | 12,940 | 9,679 | 6,106 | 5,283 | 8,127 | 14,246 | ||||
| 1990's | 12,509 | 13,061 | 7,963 | 5,541 | 597 | 743 | 906 | 1,452 | 1,132 | 1,281 |
| 2000's | 623 | 2,920 | 6,266 | 6,162 | 7,532 | 19,327 | 20,923 | 14,182 | 1,382 | 0 |
| 2010's | 0 | 0 | 1 | 0 | 0 | 0 | 0 | 0 | 0 | 0 |
| 2020's | 0 |
| - = No Data Reported; -- = Not Applicable; NA = Not Available; W = Withheld to avoid disclosure of individual company data. |
| Release Date: 2/9/2022 |
| Next Release Date: Suspended |