|
Download Data (XLS File) |
|
|||||
|
|||||
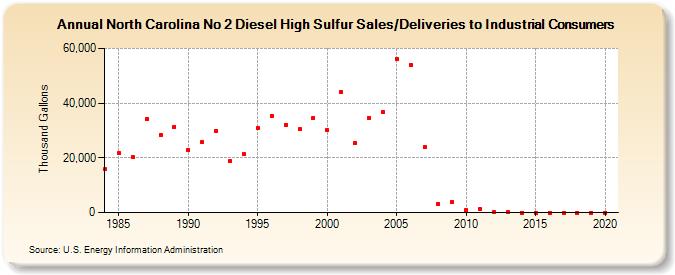
| North Carolina No 2 Diesel High Sulfur Sales/Deliveries to Industrial Consumers (Thousand Gallons) | |||||
| Decade | Year-0 | Year-1 | Year-2 | Year-3 | Year-4 | Year-5 | Year-6 | Year-7 | Year-8 | Year-9 |
|---|---|---|---|---|---|---|---|---|---|---|
| 1980's | 15,745 | 21,630 | 20,130 | 34,241 | 28,361 | 31,362 | ||||
| 1990's | 22,991 | 25,643 | 29,916 | 18,925 | 21,250 | 30,868 | 35,461 | 32,130 | 30,366 | 34,598 |
| 2000's | 30,167 | 44,180 | 25,455 | 34,742 | 36,805 | 56,153 | 54,088 | 23,950 | 3,293 | 3,914 |
| 2010's | 984 | 1,296 | 246 | 141 | 0 | 0 | 0 | 0 | 0 | 0 |
| 2020's | 0 |
| - = No Data Reported; -- = Not Applicable; NA = Not Available; W = Withheld to avoid disclosure of individual company data. |
| Release Date: 2/9/2022 |
| Next Release Date: Suspended |