|
Download Data (XLS File) |
|
|||||
|
|||||
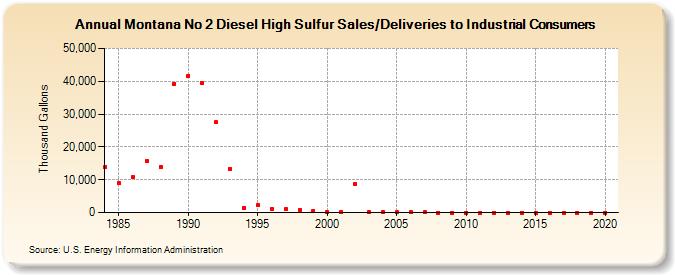
| Montana No 2 Diesel High Sulfur Sales/Deliveries to Industrial Consumers (Thousand Gallons) | |||||
| Decade | Year-0 | Year-1 | Year-2 | Year-3 | Year-4 | Year-5 | Year-6 | Year-7 | Year-8 | Year-9 |
|---|---|---|---|---|---|---|---|---|---|---|
| 1980's | 13,871 | 8,907 | 10,819 | 15,632 | 13,898 | 39,300 | ||||
| 1990's | 41,734 | 39,438 | 27,492 | 13,405 | 1,501 | 2,236 | 1,117 | 942 | 868 | 580 |
| 2000's | 151 | 232 | 8,822 | 78 | 37 | 45 | 42 | 58 | 16 | 5 |
| 2010's | 6 | 0 | 0 | 0 | 0 | 0 | 0 | 0 | 0 | 0 |
| 2020's | 0 |
| - = No Data Reported; -- = Not Applicable; NA = Not Available; W = Withheld to avoid disclosure of individual company data. |
| Release Date: 2/9/2022 |
| Next Release Date: Suspended |