|
Download Data (XLS File) |
|
|||||
|
|||||
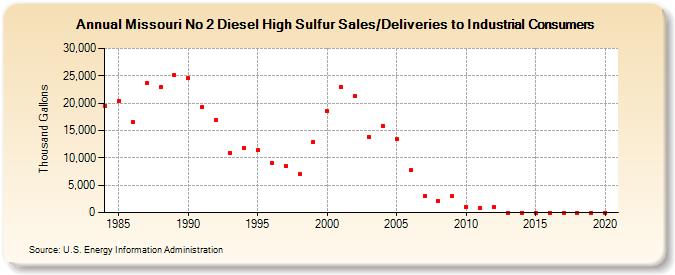
| Missouri No 2 Diesel High Sulfur Sales/Deliveries to Industrial Consumers (Thousand Gallons) | |||||
| Decade | Year-0 | Year-1 | Year-2 | Year-3 | Year-4 | Year-5 | Year-6 | Year-7 | Year-8 | Year-9 |
|---|---|---|---|---|---|---|---|---|---|---|
| 1980's | 19,528 | 20,373 | 16,484 | 23,764 | 22,902 | 25,208 | ||||
| 1990's | 24,520 | 19,245 | 16,982 | 10,956 | 11,846 | 11,366 | 9,064 | 8,519 | 6,990 | 12,940 |
| 2000's | 18,542 | 22,901 | 21,286 | 13,829 | 15,857 | 13,383 | 7,730 | 2,957 | 2,111 | 2,957 |
| 2010's | 1,049 | 920 | 973 | 0 | 0 | 0 | 0 | 0 | 0 | 0 |
| 2020's | 0 |
| - = No Data Reported; -- = Not Applicable; NA = Not Available; W = Withheld to avoid disclosure of individual company data. |
| Release Date: 2/9/2022 |
| Next Release Date: Suspended |