|
Download Data (XLS File) |
|
|||||
|
|||||
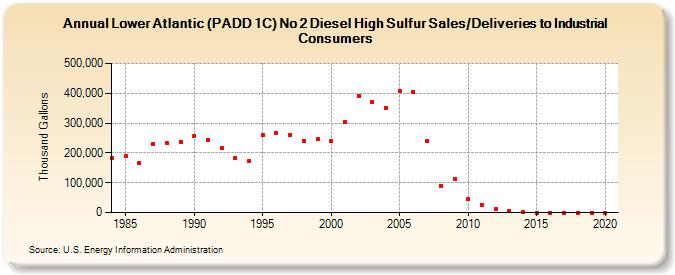
| Lower Atlantic (PADD 1C) No 2 Diesel High Sulfur Sales/Deliveries to Industrial Consumers (Thousand Gallons) | |||||
| Decade | Year-0 | Year-1 | Year-2 | Year-3 | Year-4 | Year-5 | Year-6 | Year-7 | Year-8 | Year-9 |
|---|---|---|---|---|---|---|---|---|---|---|
| 1980's | 183,648 | 189,470 | 165,734 | 230,236 | 232,044 | 238,114 | ||||
| 1990's | 255,664 | 243,494 | 215,385 | 182,658 | 171,576 | 258,978 | 267,641 | 260,311 | 239,212 | 246,198 |
| 2000's | 239,586 | 304,196 | 390,347 | 371,942 | 351,718 | 407,176 | 404,421 | 239,467 | 89,352 | 113,676 |
| 2010's | 45,680 | 25,648 | 13,013 | 6,830 | 2,291 | 67 | 0 | 0 | 0 | 0 |
| 2020's | 0 |
| - = No Data Reported; -- = Not Applicable; NA = Not Available; W = Withheld to avoid disclosure of individual company data. |
| Release Date: 2/9/2022 |
| Next Release Date: Suspended |