|
Download Data (XLS File) |
|
|||||
|
|||||
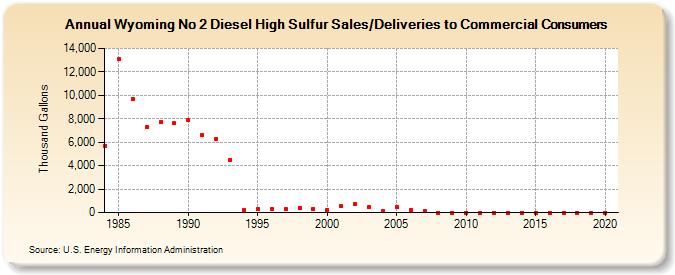
| Wyoming No 2 Diesel High Sulfur Sales/Deliveries to Commercial Consumers (Thousand Gallons) | |||||
| Decade | Year-0 | Year-1 | Year-2 | Year-3 | Year-4 | Year-5 | Year-6 | Year-7 | Year-8 | Year-9 |
|---|---|---|---|---|---|---|---|---|---|---|
| 1980's | 5,711 | 13,061 | 9,714 | 7,269 | 7,719 | 7,611 | ||||
| 1990's | 7,856 | 6,623 | 6,258 | 4,510 | 185 | 307 | 301 | 267 | 417 | 286 |
| 2000's | 238 | 521 | 755 | 462 | 147 | 480 | 234 | 152 | 0 | 0 |
| 2010's | 0 | 0 | 0 | 0 | 0 | 0 | 0 | 0 | 0 | 0 |
| 2020's | 0 |
| - = No Data Reported; -- = Not Applicable; NA = Not Available; W = Withheld to avoid disclosure of individual company data. |
| Release Date: 2/9/2022 |
| Next Release Date: Suspended |