|
Download Data (XLS File) |
|
|||||
|
|||||
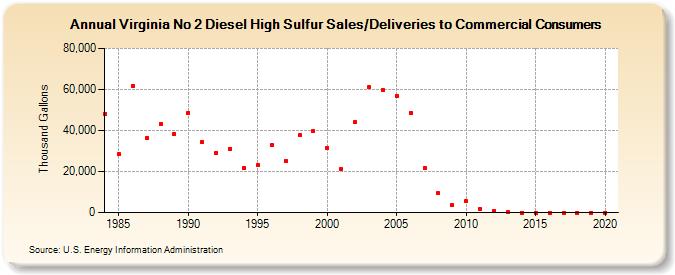
| Virginia No 2 Diesel High Sulfur Sales/Deliveries to Commercial Consumers (Thousand Gallons) | |||||
| Decade | Year-0 | Year-1 | Year-2 | Year-3 | Year-4 | Year-5 | Year-6 | Year-7 | Year-8 | Year-9 |
|---|---|---|---|---|---|---|---|---|---|---|
| 1980's | 48,136 | 28,519 | 61,710 | 36,419 | 43,056 | 38,360 | ||||
| 1990's | 48,727 | 34,323 | 29,226 | 31,129 | 21,833 | 23,184 | 32,807 | 25,264 | 37,575 | 39,847 |
| 2000's | 31,387 | 21,104 | 43,989 | 60,990 | 59,653 | 56,908 | 48,656 | 21,766 | 9,358 | 3,571 |
| 2010's | 5,397 | 1,818 | 896 | 118 | 0 | 0 | 0 | 0 | 0 | 0 |
| 2020's | 0 |
| - = No Data Reported; -- = Not Applicable; NA = Not Available; W = Withheld to avoid disclosure of individual company data. |
| Release Date: 2/9/2022 |
| Next Release Date: Suspended |