|
Download Data (XLS File) |
|
|||||
|
|||||
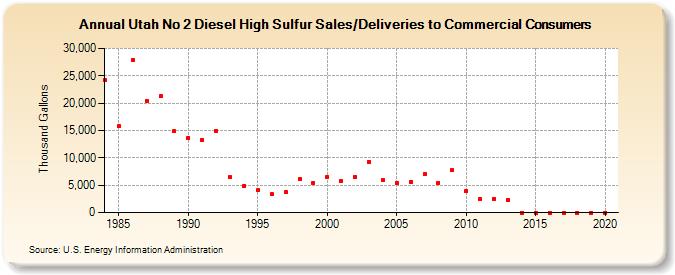
| Utah No 2 Diesel High Sulfur Sales/Deliveries to Commercial Consumers (Thousand Gallons) | |||||
| Decade | Year-0 | Year-1 | Year-2 | Year-3 | Year-4 | Year-5 | Year-6 | Year-7 | Year-8 | Year-9 |
|---|---|---|---|---|---|---|---|---|---|---|
| 1980's | 24,243 | 15,798 | 27,940 | 20,374 | 21,290 | 14,833 | ||||
| 1990's | 13,672 | 13,344 | 14,961 | 6,461 | 4,858 | 4,065 | 3,353 | 3,706 | 6,133 | 5,406 |
| 2000's | 6,539 | 5,759 | 6,559 | 9,324 | 5,922 | 5,401 | 5,543 | 7,018 | 5,487 | 7,727 |
| 2010's | 3,948 | 2,444 | 2,501 | 2,374 | 0 | 0 | 0 | 0 | 0 | 0 |
| 2020's | 0 |
| - = No Data Reported; -- = Not Applicable; NA = Not Available; W = Withheld to avoid disclosure of individual company data. |
| Release Date: 2/9/2022 |
| Next Release Date: Suspended |