|
Download Data (XLS File) |
|
|||||
|
|||||
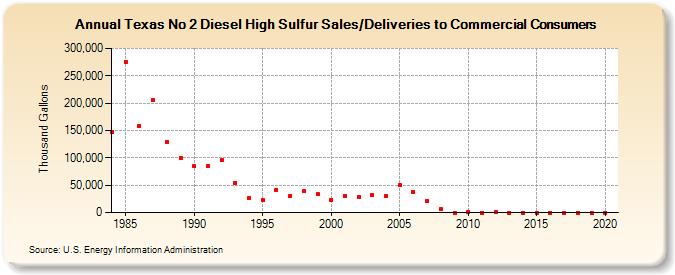
| Texas No 2 Diesel High Sulfur Sales/Deliveries to Commercial Consumers (Thousand Gallons) | |||||
| Decade | Year-0 | Year-1 | Year-2 | Year-3 | Year-4 | Year-5 | Year-6 | Year-7 | Year-8 | Year-9 |
|---|---|---|---|---|---|---|---|---|---|---|
| 1980's | 146,614 | 275,627 | 158,410 | 204,803 | 129,621 | 100,548 | ||||
| 1990's | 85,071 | 84,792 | 95,148 | 54,931 | 26,179 | 22,767 | 41,914 | 30,617 | 38,619 | 33,283 |
| 2000's | 23,796 | 30,219 | 27,538 | 32,314 | 29,952 | 49,486 | 37,380 | 21,102 | 6,000 | 101 |
| 2010's | 627 | 24 | 696 | 13 | 0 | 0 | 0 | 0 | 0 | 0 |
| 2020's | 0 |
| - = No Data Reported; -- = Not Applicable; NA = Not Available; W = Withheld to avoid disclosure of individual company data. |
| Release Date: 2/9/2022 |
| Next Release Date: Suspended |