|
Download Data (XLS File) |
|
|||||
|
|||||
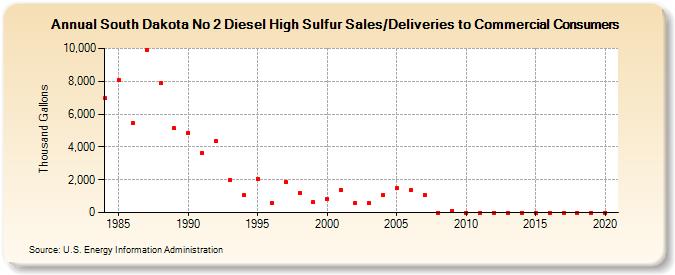
| South Dakota No 2 Diesel High Sulfur Sales/Deliveries to Commercial Consumers (Thousand Gallons) | |||||
| Decade | Year-0 | Year-1 | Year-2 | Year-3 | Year-4 | Year-5 | Year-6 | Year-7 | Year-8 | Year-9 |
|---|---|---|---|---|---|---|---|---|---|---|
| 1980's | 6,959 | 8,082 | 5,470 | 9,897 | 7,872 | 5,123 | ||||
| 1990's | 4,867 | 3,615 | 4,354 | 1,989 | 1,061 | 2,048 | 569 | 1,868 | 1,213 | 625 |
| 2000's | 844 | 1,396 | 602 | 571 | 1,081 | 1,478 | 1,353 | 1,083 | 0 | 114 |
| 2010's | 0 | 0 | 0 | 0 | 0 | 0 | 0 | 0 | 0 | 0 |
| 2020's | 0 |
| - = No Data Reported; -- = Not Applicable; NA = Not Available; W = Withheld to avoid disclosure of individual company data. |
| Release Date: 2/9/2022 |
| Next Release Date: Suspended |