|
Download Data (XLS File) |
|
|||||
|
|||||
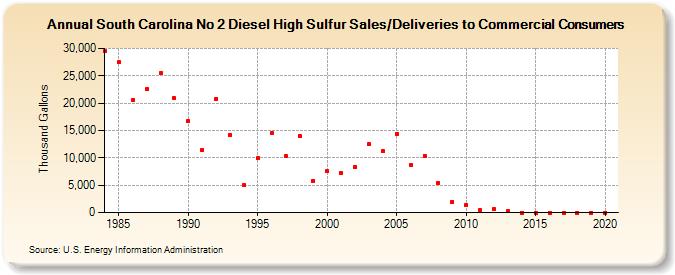
| South Carolina No 2 Diesel High Sulfur Sales/Deliveries to Commercial Consumers (Thousand Gallons) | |||||
| Decade | Year-0 | Year-1 | Year-2 | Year-3 | Year-4 | Year-5 | Year-6 | Year-7 | Year-8 | Year-9 |
|---|---|---|---|---|---|---|---|---|---|---|
| 1980's | 29,504 | 27,445 | 20,548 | 22,527 | 25,479 | 20,846 | ||||
| 1990's | 16,667 | 11,447 | 20,833 | 14,253 | 4,952 | 9,880 | 14,593 | 10,283 | 14,013 | 5,727 |
| 2000's | 7,542 | 7,260 | 8,323 | 12,512 | 11,171 | 14,356 | 8,724 | 10,397 | 5,373 | 1,990 |
| 2010's | 1,423 | 455 | 578 | 237 | 0 | 0 | 0 | 0 | 0 | 0 |
| 2020's | 0 |
| - = No Data Reported; -- = Not Applicable; NA = Not Available; W = Withheld to avoid disclosure of individual company data. |
| Release Date: 2/9/2022 |
| Next Release Date: Suspended |