|
Download Data (XLS File) |
|
|||||
|
|||||
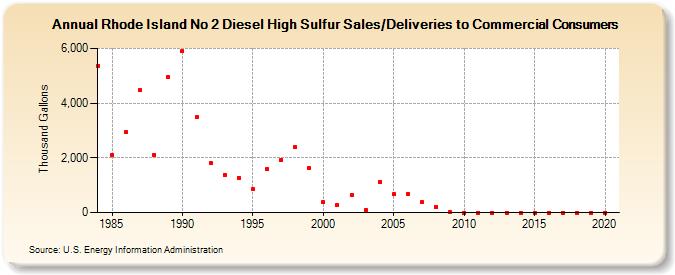
| Rhode Island No 2 Diesel High Sulfur Sales/Deliveries to Commercial Consumers (Thousand Gallons) | |||||
| Decade | Year-0 | Year-1 | Year-2 | Year-3 | Year-4 | Year-5 | Year-6 | Year-7 | Year-8 | Year-9 |
|---|---|---|---|---|---|---|---|---|---|---|
| 1980's | 5,368 | 2,118 | 2,939 | 4,461 | 2,108 | 4,946 | ||||
| 1990's | 5,894 | 3,483 | 1,813 | 1,389 | 1,276 | 860 | 1,579 | 1,930 | 2,393 | 1,622 |
| 2000's | 381 | 267 | 644 | 109 | 1,125 | 667 | 682 | 371 | 221 | 19 |
| 2010's | 0 | 0 | 0 | 0 | 0 | 0 | 0 | 0 | 0 | 0 |
| 2020's | 0 |
| - = No Data Reported; -- = Not Applicable; NA = Not Available; W = Withheld to avoid disclosure of individual company data. |
| Release Date: 2/9/2022 |
| Next Release Date: Suspended |