|
Download Data (XLS File) |
|
|||||
|
|||||
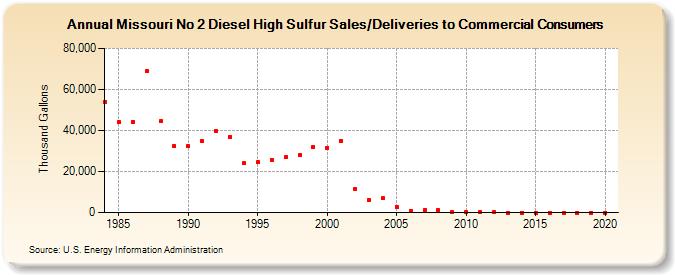
| Missouri No 2 Diesel High Sulfur Sales/Deliveries to Commercial Consumers (Thousand Gallons) | |||||
| Decade | Year-0 | Year-1 | Year-2 | Year-3 | Year-4 | Year-5 | Year-6 | Year-7 | Year-8 | Year-9 |
|---|---|---|---|---|---|---|---|---|---|---|
| 1980's | 53,900 | 44,037 | 44,256 | 68,855 | 44,570 | 32,414 | ||||
| 1990's | 32,344 | 34,860 | 39,716 | 37,008 | 23,932 | 24,437 | 25,660 | 27,066 | 28,166 | 32,129 |
| 2000's | 31,493 | 35,050 | 11,530 | 6,159 | 6,876 | 2,944 | 812 | 1,143 | 1,031 | 208 |
| 2010's | 193 | 169 | 179 | 0 | 0 | 0 | 0 | 0 | 0 | 0 |
| 2020's | 0 |
| - = No Data Reported; -- = Not Applicable; NA = Not Available; W = Withheld to avoid disclosure of individual company data. |
| Release Date: 2/9/2022 |
| Next Release Date: Suspended |