|
Download Data (XLS File) |
|
|||||
|
|||||
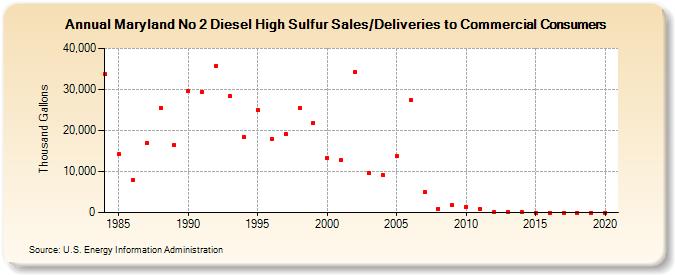
| Maryland No 2 Diesel High Sulfur Sales/Deliveries to Commercial Consumers (Thousand Gallons) | |||||
| Decade | Year-0 | Year-1 | Year-2 | Year-3 | Year-4 | Year-5 | Year-6 | Year-7 | Year-8 | Year-9 |
|---|---|---|---|---|---|---|---|---|---|---|
| 1980's | 33,668 | 14,196 | 7,973 | 16,926 | 25,476 | 16,470 | ||||
| 1990's | 29,564 | 29,446 | 35,791 | 28,318 | 18,467 | 24,987 | 17,986 | 19,117 | 25,418 | 21,931 |
| 2000's | 13,337 | 12,746 | 34,314 | 9,744 | 9,135 | 13,737 | 27,404 | 5,018 | 932 | 1,722 |
| 2010's | 1,323 | 924 | 222 | 206 | 209 | 0 | 0 | 0 | 0 | 0 |
| 2020's | 0 |
| - = No Data Reported; -- = Not Applicable; NA = Not Available; W = Withheld to avoid disclosure of individual company data. |
| Release Date: 2/9/2022 |
| Next Release Date: Suspended |