|
Download Data (XLS File) |
|
|||||
|
|||||
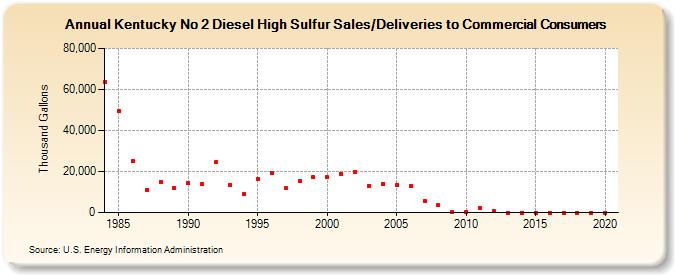
| Kentucky No 2 Diesel High Sulfur Sales/Deliveries to Commercial Consumers (Thousand Gallons) | |||||
| Decade | Year-0 | Year-1 | Year-2 | Year-3 | Year-4 | Year-5 | Year-6 | Year-7 | Year-8 | Year-9 |
|---|---|---|---|---|---|---|---|---|---|---|
| 1980's | 63,764 | 49,248 | 24,983 | 10,782 | 14,980 | 12,064 | ||||
| 1990's | 14,309 | 13,985 | 24,645 | 13,528 | 9,086 | 16,391 | 19,444 | 11,827 | 15,156 | 17,208 |
| 2000's | 17,095 | 18,994 | 19,927 | 13,105 | 13,930 | 13,351 | 13,085 | 5,680 | 3,445 | 463 |
| 2010's | 456 | 2,444 | 546 | 0 | 0 | 0 | 0 | 0 | 0 | 0 |
| 2020's | 0 |
| - = No Data Reported; -- = Not Applicable; NA = Not Available; W = Withheld to avoid disclosure of individual company data. |
| Release Date: 2/9/2022 |
| Next Release Date: Suspended |