|
Download Data (XLS File) |
|
|||||
|
|||||
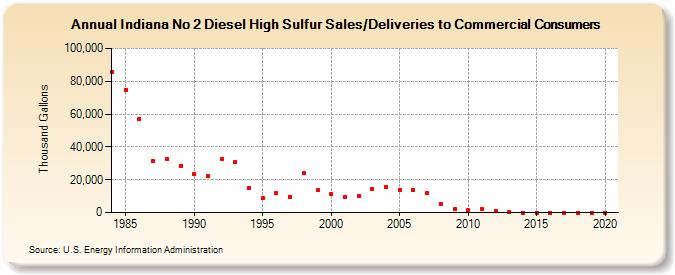
| Indiana No 2 Diesel High Sulfur Sales/Deliveries to Commercial Consumers (Thousand Gallons) | |||||
| Decade | Year-0 | Year-1 | Year-2 | Year-3 | Year-4 | Year-5 | Year-6 | Year-7 | Year-8 | Year-9 |
|---|---|---|---|---|---|---|---|---|---|---|
| 1980's | 85,478 | 74,906 | 57,264 | 31,698 | 32,500 | 28,374 | ||||
| 1990's | 23,539 | 22,259 | 32,726 | 30,499 | 14,680 | 9,123 | 11,956 | 9,697 | 23,950 | 13,665 |
| 2000's | 11,296 | 9,309 | 9,809 | 14,528 | 15,750 | 13,698 | 13,635 | 12,033 | 5,472 | 2,121 |
| 2010's | 1,510 | 2,175 | 837 | 620 | 0 | 0 | 0 | 0 | 0 | 0 |
| 2020's | 0 |
| - = No Data Reported; -- = Not Applicable; NA = Not Available; W = Withheld to avoid disclosure of individual company data. |
| Release Date: 2/9/2022 |
| Next Release Date: Suspended |