|
Download Data (XLS File) |
|
|||||
|
|||||
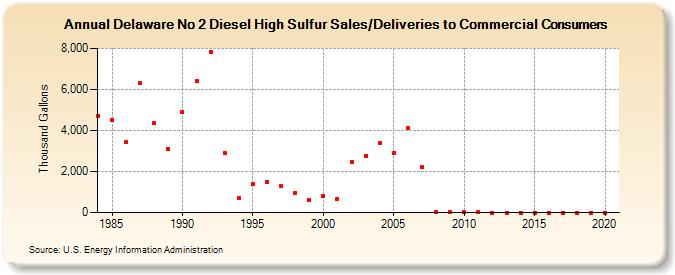
| Delaware No 2 Diesel High Sulfur Sales/Deliveries to Commercial Consumers (Thousand Gallons) | |||||
| Decade | Year-0 | Year-1 | Year-2 | Year-3 | Year-4 | Year-5 | Year-6 | Year-7 | Year-8 | Year-9 |
|---|---|---|---|---|---|---|---|---|---|---|
| 1980's | 4,701 | 4,518 | 3,417 | 6,308 | 4,388 | 3,082 | ||||
| 1990's | 4,920 | 6,394 | 7,843 | 2,919 | 706 | 1,371 | 1,510 | 1,278 | 973 | 596 |
| 2000's | 796 | 669 | 2,476 | 2,771 | 3,401 | 2,898 | 4,137 | 2,202 | 17 | 23 |
| 2010's | 4 | 19 | 0 | 0 | 0 | 0 | 0 | 0 | 0 | 0 |
| 2020's | 0 |
| - = No Data Reported; -- = Not Applicable; NA = Not Available; W = Withheld to avoid disclosure of individual company data. |
| Release Date: 2/9/2022 |
| Next Release Date: Suspended |