|
Download Data (XLS File) |
|
|||||
|
|||||
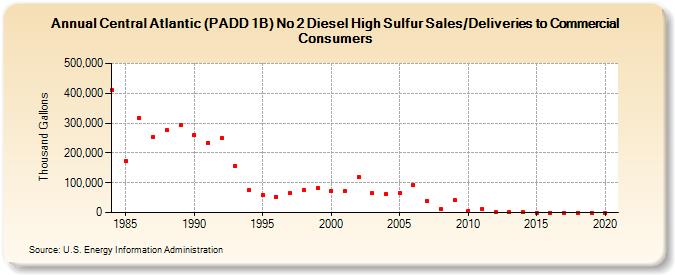
| Central Atlantic (PADD 1B) No 2 Diesel High Sulfur Sales/Deliveries to Commercial Consumers (Thousand Gallons) | |||||
| Decade | Year-0 | Year-1 | Year-2 | Year-3 | Year-4 | Year-5 | Year-6 | Year-7 | Year-8 | Year-9 |
|---|---|---|---|---|---|---|---|---|---|---|
| 1980's | 410,161 | 173,209 | 316,481 | 253,524 | 275,415 | 294,408 | ||||
| 1990's | 259,743 | 234,155 | 251,149 | 155,360 | 75,470 | 58,062 | 53,344 | 65,008 | 75,924 | 82,846 |
| 2000's | 72,984 | 71,796 | 119,326 | 65,824 | 62,767 | 64,818 | 92,279 | 37,817 | 12,306 | 41,531 |
| 2010's | 4,943 | 12,634 | 2,456 | 428 | 301 | 0 | 0 | 0 | 0 | 0 |
| 2020's | 0 |
| - = No Data Reported; -- = Not Applicable; NA = Not Available; W = Withheld to avoid disclosure of individual company data. |
| Release Date: 2/9/2022 |
| Next Release Date: Suspended |