|
Download Data (XLS File) |
|
|||||
|
|||||
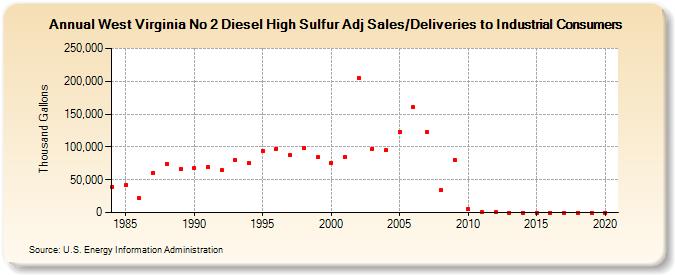
| West Virginia No 2 Diesel High Sulfur Adj Sales/Deliveries to Industrial Consumers (Thousand Gallons) | |||||
| Decade | Year-0 | Year-1 | Year-2 | Year-3 | Year-4 | Year-5 | Year-6 | Year-7 | Year-8 | Year-9 |
|---|---|---|---|---|---|---|---|---|---|---|
| 1980's | 39,082 | 41,700 | 21,673 | 60,679 | 74,031 | 66,128 | ||||
| 1990's | 67,608 | 69,258 | 64,353 | 79,919 | 75,241 | 93,836 | 97,326 | 87,308 | 98,281 | 84,216 |
| 2000's | 75,513 | 84,480 | 205,181 | 97,244 | 95,178 | 122,989 | 160,192 | 122,192 | 34,010 | 80,692 |
| 2010's | 5,394 | 495 | 126 | 58 | 0 | 0 | 0 | 0 | 0 | 0 |
| 2020's | 0 |
| - = No Data Reported; -- = Not Applicable; NA = Not Available; W = Withheld to avoid disclosure of individual company data. |
| Release Date: 2/9/2022 |
| Next Release Date: Suspended |