|
Download Data (XLS File) |
|
|||||
|
|||||
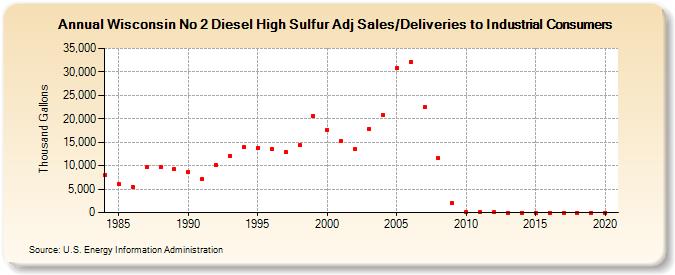
| Wisconsin No 2 Diesel High Sulfur Adj Sales/Deliveries to Industrial Consumers (Thousand Gallons) | |||||
| Decade | Year-0 | Year-1 | Year-2 | Year-3 | Year-4 | Year-5 | Year-6 | Year-7 | Year-8 | Year-9 |
|---|---|---|---|---|---|---|---|---|---|---|
| 1980's | 7,947 | 6,080 | 5,497 | 9,753 | 9,708 | 9,237 | ||||
| 1990's | 8,624 | 7,146 | 10,090 | 12,138 | 13,938 | 13,826 | 13,601 | 12,911 | 14,311 | 20,561 |
| 2000's | 17,625 | 15,188 | 13,463 | 17,896 | 20,857 | 30,842 | 32,159 | 22,426 | 11,651 | 2,089 |
| 2010's | 146 | 69 | 57 | 0 | 0 | 0 | 0 | 0 | 0 | 0 |
| 2020's | 0 |
| - = No Data Reported; -- = Not Applicable; NA = Not Available; W = Withheld to avoid disclosure of individual company data. |
| Release Date: 2/9/2022 |
| Next Release Date: Suspended |