|
Download Data (XLS File) |
|
|||||
|
|||||
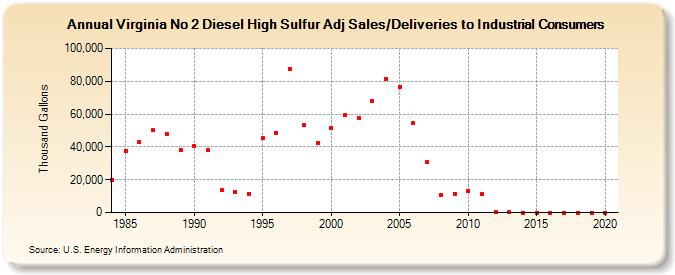
| Virginia No 2 Diesel High Sulfur Adj Sales/Deliveries to Industrial Consumers (Thousand Gallons) | |||||
| Decade | Year-0 | Year-1 | Year-2 | Year-3 | Year-4 | Year-5 | Year-6 | Year-7 | Year-8 | Year-9 |
|---|---|---|---|---|---|---|---|---|---|---|
| 1980's | 20,092 | 37,667 | 42,715 | 49,998 | 47,928 | 37,968 | ||||
| 1990's | 40,829 | 37,803 | 13,545 | 12,412 | 11,478 | 45,316 | 48,640 | 87,564 | 53,545 | 42,251 |
| 2000's | 51,383 | 59,523 | 57,782 | 67,881 | 81,430 | 76,719 | 54,372 | 30,943 | 10,521 | 11,316 |
| 2010's | 13,217 | 11,432 | 415 | 351 | 0 | 0 | 0 | 0 | 0 | 0 |
| 2020's | 0 |
| - = No Data Reported; -- = Not Applicable; NA = Not Available; W = Withheld to avoid disclosure of individual company data. |
| Release Date: 2/9/2022 |
| Next Release Date: Suspended |