|
Download Data (XLS File) |
|
|||||
|
|||||
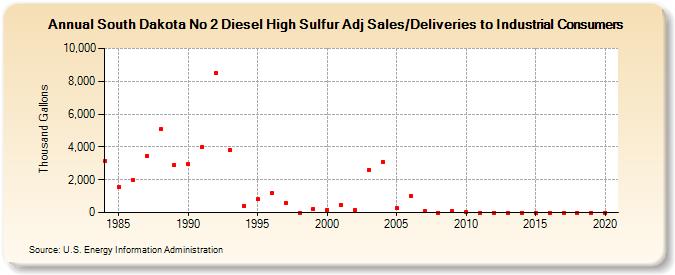
| South Dakota No 2 Diesel High Sulfur Adj Sales/Deliveries to Industrial Consumers (Thousand Gallons) | |||||
| Decade | Year-0 | Year-1 | Year-2 | Year-3 | Year-4 | Year-5 | Year-6 | Year-7 | Year-8 | Year-9 |
|---|---|---|---|---|---|---|---|---|---|---|
| 1980's | 3,148 | 1,585 | 1,980 | 3,467 | 5,087 | 2,884 | ||||
| 1990's | 2,933 | 3,971 | 8,508 | 3,813 | 415 | 807 | 1,166 | 601 | 0 | 210 |
| 2000's | 181 | 477 | 156 | 2,598 | 3,091 | 257 | 1,018 | 81 | 0 | 102 |
| 2010's | 53 | 0 | 0 | 0 | 0 | 0 | 0 | 0 | 0 | 0 |
| 2020's | 0 |
| - = No Data Reported; -- = Not Applicable; NA = Not Available; W = Withheld to avoid disclosure of individual company data. |
| Release Date: 2/9/2022 |
| Next Release Date: Suspended |