|
Download Data (XLS File) |
|
|||||
|
|||||
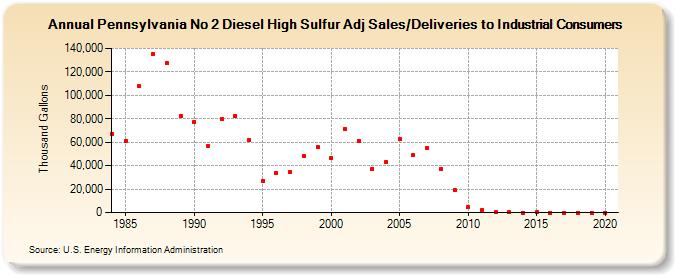
| Pennsylvania No 2 Diesel High Sulfur Adj Sales/Deliveries to Industrial Consumers (Thousand Gallons) | |||||
| Decade | Year-0 | Year-1 | Year-2 | Year-3 | Year-4 | Year-5 | Year-6 | Year-7 | Year-8 | Year-9 |
|---|---|---|---|---|---|---|---|---|---|---|
| 1980's | 67,150 | 60,920 | 107,647 | 135,608 | 127,130 | 82,075 | ||||
| 1990's | 77,409 | 57,060 | 79,825 | 82,689 | 61,819 | 26,594 | 33,905 | 34,296 | 47,887 | 55,893 |
| 2000's | 46,397 | 71,470 | 61,245 | 37,395 | 43,102 | 62,304 | 48,918 | 54,636 | 37,446 | 19,104 |
| 2010's | 4,555 | 1,770 | 104 | 56 | 0 | 86 | 0 | 0 | 0 | 0 |
| 2020's | 0 |
| - = No Data Reported; -- = Not Applicable; NA = Not Available; W = Withheld to avoid disclosure of individual company data. |
| Release Date: 2/9/2022 |
| Next Release Date: Suspended |