|
Download Data (XLS File) |
|
|||||
|
|||||
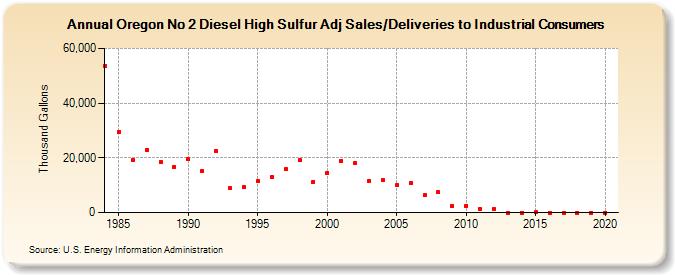
| Oregon No 2 Diesel High Sulfur Adj Sales/Deliveries to Industrial Consumers (Thousand Gallons) | |||||
| Decade | Year-0 | Year-1 | Year-2 | Year-3 | Year-4 | Year-5 | Year-6 | Year-7 | Year-8 | Year-9 |
|---|---|---|---|---|---|---|---|---|---|---|
| 1980's | 53,570 | 29,524 | 19,219 | 22,866 | 18,550 | 16,674 | ||||
| 1990's | 19,448 | 15,210 | 22,400 | 8,859 | 9,315 | 11,500 | 12,976 | 15,807 | 19,033 | 11,295 |
| 2000's | 14,492 | 18,859 | 18,214 | 11,568 | 11,836 | 9,926 | 10,950 | 6,322 | 7,496 | 2,411 |
| 2010's | 2,497 | 1,284 | 1,373 | 0 | 0 | 50 | 0 | 0 | 0 | 0 |
| 2020's | 0 |
| - = No Data Reported; -- = Not Applicable; NA = Not Available; W = Withheld to avoid disclosure of individual company data. |
| Release Date: 2/9/2022 |
| Next Release Date: Suspended |