|
Download Data (XLS File) |
|
|||||
|
|||||
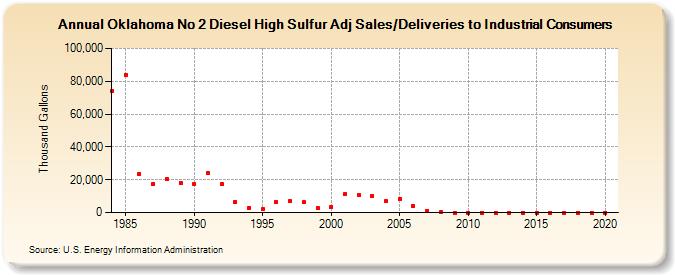
| Oklahoma No 2 Diesel High Sulfur Adj Sales/Deliveries to Industrial Consumers (Thousand Gallons) | |||||
| Decade | Year-0 | Year-1 | Year-2 | Year-3 | Year-4 | Year-5 | Year-6 | Year-7 | Year-8 | Year-9 |
|---|---|---|---|---|---|---|---|---|---|---|
| 1980's | 73,978 | 84,013 | 23,616 | 17,441 | 20,593 | 18,028 | ||||
| 1990's | 17,145 | 24,161 | 17,374 | 6,627 | 3,043 | 1,939 | 6,363 | 6,777 | 6,361 | 2,988 |
| 2000's | 3,472 | 11,205 | 10,899 | 10,268 | 6,774 | 8,420 | 4,154 | 1,120 | 624 | 29 |
| 2010's | 1 | 0 | 0 | 0 | 0 | 0 | 0 | 0 | 0 | 0 |
| 2020's | 0 |
| - = No Data Reported; -- = Not Applicable; NA = Not Available; W = Withheld to avoid disclosure of individual company data. |
| Release Date: 2/9/2022 |
| Next Release Date: Suspended |