|
Download Data (XLS File) |
|
|||||
|
|||||
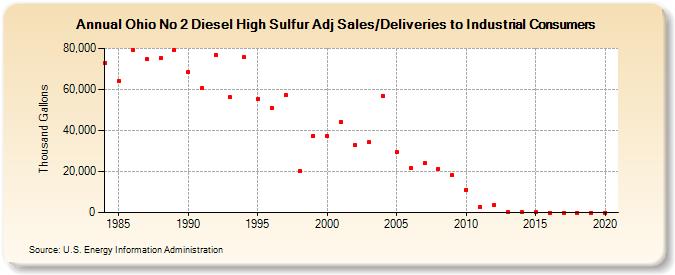
| Ohio No 2 Diesel High Sulfur Adj Sales/Deliveries to Industrial Consumers (Thousand Gallons) | |||||
| Decade | Year-0 | Year-1 | Year-2 | Year-3 | Year-4 | Year-5 | Year-6 | Year-7 | Year-8 | Year-9 |
|---|---|---|---|---|---|---|---|---|---|---|
| 1980's | 73,118 | 64,013 | 79,371 | 74,804 | 75,272 | 79,306 | ||||
| 1990's | 68,516 | 60,547 | 76,740 | 56,090 | 75,616 | 55,349 | 51,147 | 57,276 | 20,236 | 37,404 |
| 2000's | 37,166 | 44,029 | 32,843 | 34,254 | 56,998 | 29,407 | 21,656 | 23,953 | 21,327 | 18,133 |
| 2010's | 11,233 | 2,896 | 3,645 | 53 | 72 | 53 | 0 | 0 | 0 | 0 |
| 2020's | 0 |
| - = No Data Reported; -- = Not Applicable; NA = Not Available; W = Withheld to avoid disclosure of individual company data. |
| Release Date: 2/9/2022 |
| Next Release Date: Suspended |