|
Download Data (XLS File) |
|
|||||
|
|||||
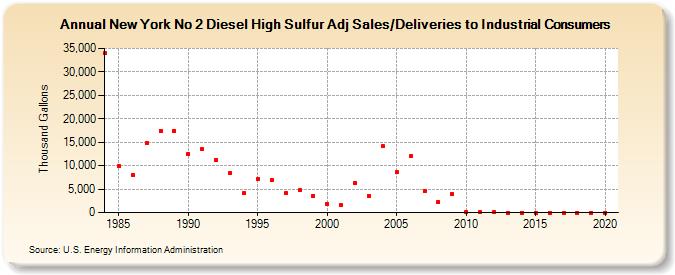
| New York No 2 Diesel High Sulfur Adj Sales/Deliveries to Industrial Consumers (Thousand Gallons) | |||||
| Decade | Year-0 | Year-1 | Year-2 | Year-3 | Year-4 | Year-5 | Year-6 | Year-7 | Year-8 | Year-9 |
|---|---|---|---|---|---|---|---|---|---|---|
| 1980's | 33,945 | 9,847 | 8,027 | 14,909 | 17,470 | 17,417 | ||||
| 1990's | 12,525 | 13,484 | 11,204 | 8,411 | 4,154 | 7,157 | 6,927 | 4,119 | 4,720 | 3,585 |
| 2000's | 1,781 | 1,513 | 6,256 | 3,606 | 14,127 | 8,570 | 11,979 | 4,558 | 2,301 | 3,921 |
| 2010's | 217 | 47 | 155 | 0 | 0 | 0 | 0 | 0 | 0 | 0 |
| 2020's | 0 |
| - = No Data Reported; -- = Not Applicable; NA = Not Available; W = Withheld to avoid disclosure of individual company data. |
| Release Date: 2/9/2022 |
| Next Release Date: Suspended |