|
Download Data (XLS File) |
|
|||||
|
|||||
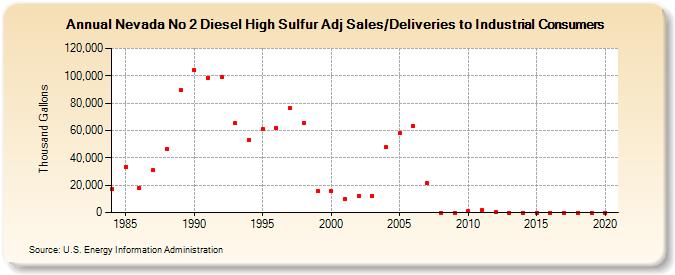
| Nevada No 2 Diesel High Sulfur Adj Sales/Deliveries to Industrial Consumers (Thousand Gallons) | |||||
| Decade | Year-0 | Year-1 | Year-2 | Year-3 | Year-4 | Year-5 | Year-6 | Year-7 | Year-8 | Year-9 |
|---|---|---|---|---|---|---|---|---|---|---|
| 1980's | 16,925 | 33,527 | 17,914 | 30,919 | 46,413 | 89,326 | ||||
| 1990's | 104,028 | 98,663 | 99,173 | 65,105 | 53,310 | 61,057 | 61,707 | 76,187 | 65,823 | 15,427 |
| 2000's | 15,467 | 9,959 | 12,289 | 12,215 | 47,788 | 58,127 | 63,420 | 21,295 | 30 | 0 |
| 2010's | 830 | 1,612 | 434 | 0 | 0 | 0 | 0 | 0 | 0 | 0 |
| 2020's | 0 |
| - = No Data Reported; -- = Not Applicable; NA = Not Available; W = Withheld to avoid disclosure of individual company data. |
| Release Date: 2/9/2022 |
| Next Release Date: Suspended |