|
Download Data (XLS File) |
|
|||||
|
|||||
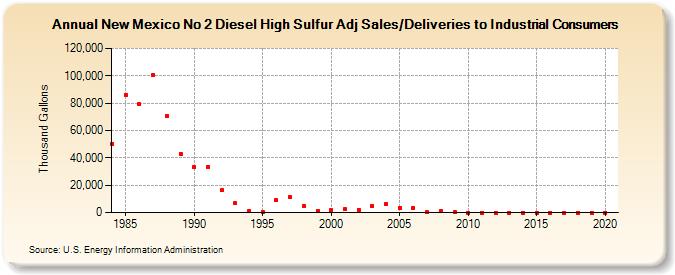
| New Mexico No 2 Diesel High Sulfur Adj Sales/Deliveries to Industrial Consumers (Thousand Gallons) | |||||
| Decade | Year-0 | Year-1 | Year-2 | Year-3 | Year-4 | Year-5 | Year-6 | Year-7 | Year-8 | Year-9 |
|---|---|---|---|---|---|---|---|---|---|---|
| 1980's | 50,376 | 85,933 | 79,009 | 100,699 | 70,513 | 42,976 | ||||
| 1990's | 32,955 | 33,470 | 16,205 | 6,759 | 1,110 | 609 | 8,996 | 11,229 | 4,751 | 1,410 |
| 2000's | 1,793 | 2,299 | 2,146 | 4,678 | 6,200 | 3,581 | 3,547 | 164 | 1,002 | 178 |
| 2010's | 0 | 0 | 0 | 0 | 0 | 0 | 0 | 0 | 0 | 0 |
| 2020's | 0 |
| - = No Data Reported; -- = Not Applicable; NA = Not Available; W = Withheld to avoid disclosure of individual company data. |
| Release Date: 2/9/2022 |
| Next Release Date: Suspended |