|
Download Data (XLS File) |
|
|||||
|
|||||
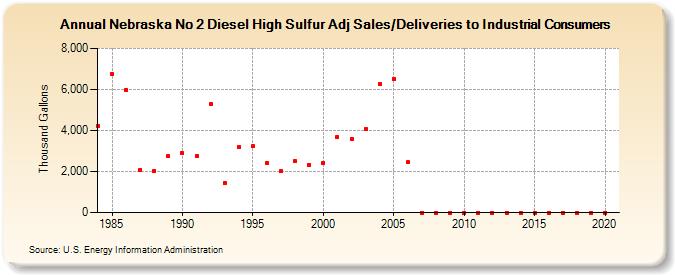
| Nebraska No 2 Diesel High Sulfur Adj Sales/Deliveries to Industrial Consumers (Thousand Gallons) | |||||
| Decade | Year-0 | Year-1 | Year-2 | Year-3 | Year-4 | Year-5 | Year-6 | Year-7 | Year-8 | Year-9 |
|---|---|---|---|---|---|---|---|---|---|---|
| 1980's | 4,232 | 6,771 | 5,977 | 2,089 | 2,039 | 2,740 | ||||
| 1990's | 2,898 | 2,750 | 5,279 | 1,451 | 3,192 | 3,222 | 2,415 | 2,011 | 2,510 | 2,334 |
| 2000's | 2,406 | 3,673 | 3,588 | 4,073 | 6,254 | 6,524 | 2,441 | 0 | 0 | 0 |
| 2010's | 0 | 0 | 0 | 0 | 0 | 0 | 0 | 0 | 0 | 0 |
| 2020's | 0 |
| - = No Data Reported; -- = Not Applicable; NA = Not Available; W = Withheld to avoid disclosure of individual company data. |
| Release Date: 2/9/2022 |
| Next Release Date: Suspended |