|
Download Data (XLS File) |
|
|||||
|
|||||
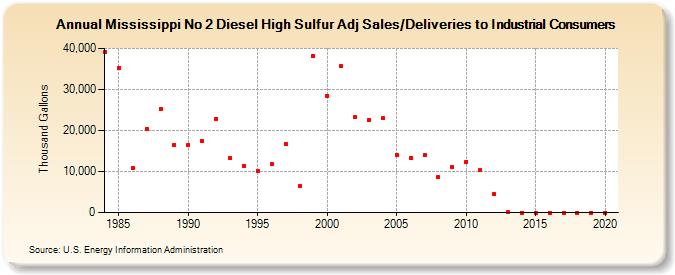
| Mississippi No 2 Diesel High Sulfur Adj Sales/Deliveries to Industrial Consumers (Thousand Gallons) | |||||
| Decade | Year-0 | Year-1 | Year-2 | Year-3 | Year-4 | Year-5 | Year-6 | Year-7 | Year-8 | Year-9 |
|---|---|---|---|---|---|---|---|---|---|---|
| 1980's | 39,241 | 35,314 | 10,918 | 20,420 | 25,295 | 16,545 | ||||
| 1990's | 16,470 | 17,381 | 22,809 | 13,350 | 11,417 | 10,127 | 11,814 | 16,822 | 6,475 | 38,190 |
| 2000's | 28,491 | 35,627 | 23,213 | 22,658 | 23,007 | 14,144 | 13,314 | 13,930 | 8,603 | 11,110 |
| 2010's | 12,385 | 10,333 | 4,554 | 44 | 0 | 0 | 0 | 0 | 0 | 0 |
| 2020's | 0 |
| - = No Data Reported; -- = Not Applicable; NA = Not Available; W = Withheld to avoid disclosure of individual company data. |
| Release Date: 2/9/2022 |
| Next Release Date: Suspended |