|
Download Data (XLS File) |
|
|||||
|
|||||
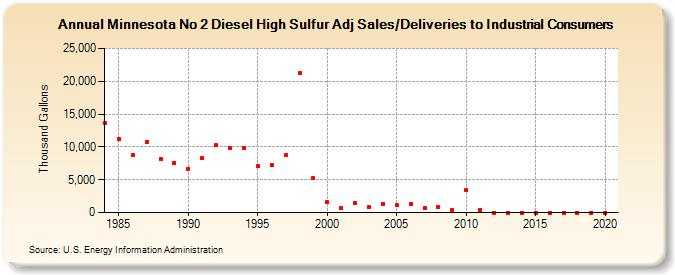
| Minnesota No 2 Diesel High Sulfur Adj Sales/Deliveries to Industrial Consumers (Thousand Gallons) | |||||
| Decade | Year-0 | Year-1 | Year-2 | Year-3 | Year-4 | Year-5 | Year-6 | Year-7 | Year-8 | Year-9 |
|---|---|---|---|---|---|---|---|---|---|---|
| 1980's | 13,625 | 11,193 | 8,820 | 10,775 | 8,168 | 7,562 | ||||
| 1990's | 6,590 | 8,351 | 10,318 | 9,809 | 9,761 | 7,028 | 7,191 | 8,839 | 21,204 | 5,237 |
| 2000's | 1,540 | 620 | 1,520 | 890 | 1,314 | 1,100 | 1,369 | 703 | 827 | 424 |
| 2010's | 3,452 | 449 | 0 | 0 | 0 | 0 | 0 | 0 | 0 | 0 |
| 2020's | 0 |
| - = No Data Reported; -- = Not Applicable; NA = Not Available; W = Withheld to avoid disclosure of individual company data. |
| Release Date: 2/9/2022 |
| Next Release Date: Suspended |