|
Download Data (XLS File) |
|
|||||
|
|||||
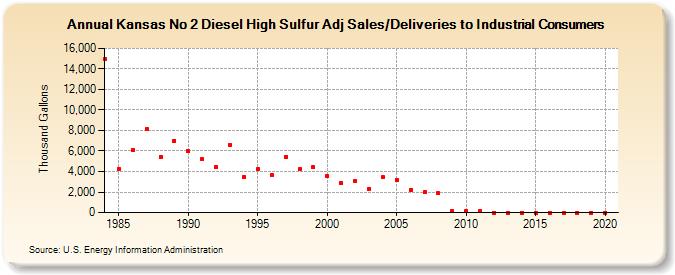
| Kansas No 2 Diesel High Sulfur Adj Sales/Deliveries to Industrial Consumers (Thousand Gallons) | |||||
| Decade | Year-0 | Year-1 | Year-2 | Year-3 | Year-4 | Year-5 | Year-6 | Year-7 | Year-8 | Year-9 |
|---|---|---|---|---|---|---|---|---|---|---|
| 1980's | 14,979 | 4,253 | 6,134 | 8,153 | 5,451 | 7,007 | ||||
| 1990's | 5,956 | 5,218 | 4,412 | 6,621 | 3,492 | 4,225 | 3,670 | 5,452 | 4,208 | 4,408 |
| 2000's | 3,558 | 2,907 | 3,081 | 2,301 | 3,456 | 3,199 | 2,231 | 1,985 | 1,868 | 164 |
| 2010's | 174 | 139 | 0 | 0 | 0 | 0 | 0 | 0 | 0 | 0 |
| 2020's | 0 |
| - = No Data Reported; -- = Not Applicable; NA = Not Available; W = Withheld to avoid disclosure of individual company data. |
| Release Date: 2/9/2022 |
| Next Release Date: Suspended |