|
Download Data (XLS File) |
|
|||||
|
|||||
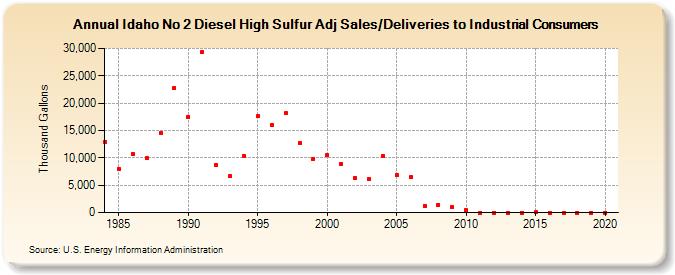
| Idaho No 2 Diesel High Sulfur Adj Sales/Deliveries to Industrial Consumers (Thousand Gallons) | |||||
| Decade | Year-0 | Year-1 | Year-2 | Year-3 | Year-4 | Year-5 | Year-6 | Year-7 | Year-8 | Year-9 |
|---|---|---|---|---|---|---|---|---|---|---|
| 1980's | 12,959 | 7,986 | 10,687 | 9,960 | 14,566 | 22,782 | ||||
| 1990's | 17,525 | 29,314 | 8,608 | 6,672 | 10,405 | 17,649 | 16,008 | 18,144 | 12,698 | 9,833 |
| 2000's | 10,512 | 8,877 | 6,345 | 6,124 | 10,353 | 6,861 | 6,424 | 1,264 | 1,410 | 969 |
| 2010's | 450 | 0 | 0 | 0 | 8 | 52 | 0 | 0 | 0 | 0 |
| 2020's | 0 |
| - = No Data Reported; -- = Not Applicable; NA = Not Available; W = Withheld to avoid disclosure of individual company data. |
| Release Date: 2/9/2022 |
| Next Release Date: Suspended |