|
Download Data (XLS File) |
|
|||||
|
|||||
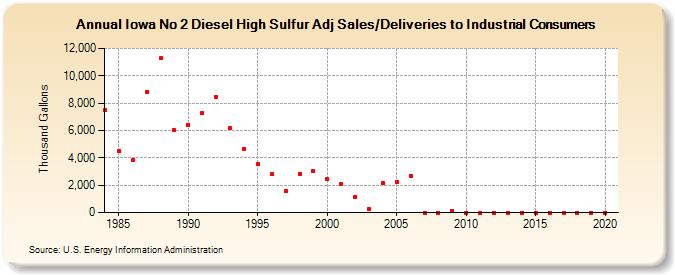
| Iowa No 2 Diesel High Sulfur Adj Sales/Deliveries to Industrial Consumers (Thousand Gallons) | |||||
| Decade | Year-0 | Year-1 | Year-2 | Year-3 | Year-4 | Year-5 | Year-6 | Year-7 | Year-8 | Year-9 |
|---|---|---|---|---|---|---|---|---|---|---|
| 1980's | 7,484 | 4,470 | 3,838 | 8,795 | 11,268 | 6,009 | ||||
| 1990's | 6,402 | 7,288 | 8,428 | 6,150 | 4,656 | 3,571 | 2,826 | 1,556 | 2,801 | 3,011 |
| 2000's | 2,489 | 2,052 | 1,146 | 252 | 2,145 | 2,247 | 2,694 | 0 | 0 | 141 |
| 2010's | 0 | 0 | 0 | 0 | 0 | 0 | 0 | 0 | 0 | 0 |
| 2020's | 0 |
| - = No Data Reported; -- = Not Applicable; NA = Not Available; W = Withheld to avoid disclosure of individual company data. |
| Release Date: 2/9/2022 |
| Next Release Date: Suspended |