|
Download Data (XLS File) |
|
|||||
|
|||||
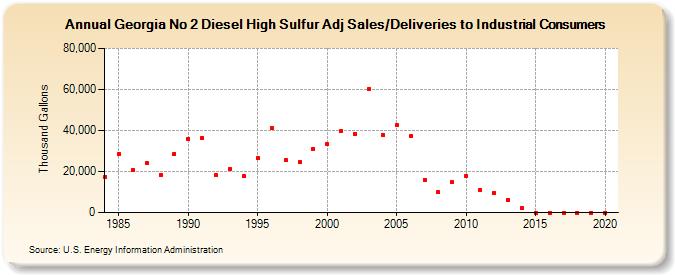
| Georgia No 2 Diesel High Sulfur Adj Sales/Deliveries to Industrial Consumers (Thousand Gallons) | |||||
| Decade | Year-0 | Year-1 | Year-2 | Year-3 | Year-4 | Year-5 | Year-6 | Year-7 | Year-8 | Year-9 |
|---|---|---|---|---|---|---|---|---|---|---|
| 1980's | 17,341 | 28,649 | 20,980 | 24,175 | 18,207 | 28,660 | ||||
| 1990's | 35,950 | 36,497 | 18,277 | 21,226 | 17,592 | 26,555 | 41,136 | 25,502 | 24,445 | 30,921 |
| 2000's | 33,311 | 39,923 | 38,378 | 60,239 | 37,859 | 42,774 | 37,418 | 15,970 | 9,934 | 14,699 |
| 2010's | 17,900 | 11,193 | 9,769 | 6,254 | 2,417 | 0 | 0 | 0 | 0 | 0 |
| 2020's | 0 |
| - = No Data Reported; -- = Not Applicable; NA = Not Available; W = Withheld to avoid disclosure of individual company data. |
| Release Date: 2/9/2022 |
| Next Release Date: Suspended |