|
Download Data (XLS File) |
|
|||||
|
|||||
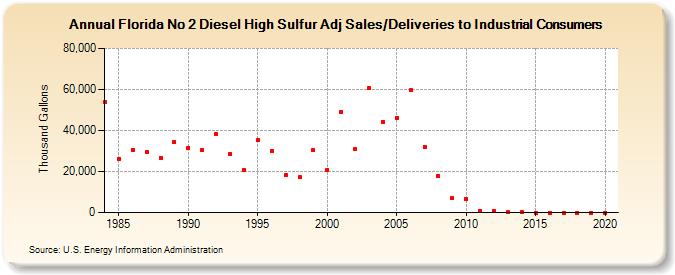
| Florida No 2 Diesel High Sulfur Adj Sales/Deliveries to Industrial Consumers (Thousand Gallons) | |||||
| Decade | Year-0 | Year-1 | Year-2 | Year-3 | Year-4 | Year-5 | Year-6 | Year-7 | Year-8 | Year-9 |
|---|---|---|---|---|---|---|---|---|---|---|
| 1980's | 53,854 | 26,332 | 30,374 | 29,628 | 26,693 | 34,304 | ||||
| 1990's | 31,633 | 30,455 | 38,070 | 28,686 | 20,886 | 35,477 | 29,843 | 18,066 | 17,313 | 30,286 |
| 2000's | 20,938 | 49,101 | 30,807 | 60,685 | 44,319 | 46,255 | 59,611 | 32,125 | 17,706 | 6,876 |
| 2010's | 6,516 | 967 | 825 | 44 | 31 | 0 | 0 | 0 | 0 | 0 |
| 2020's | 0 |
| - = No Data Reported; -- = Not Applicable; NA = Not Available; W = Withheld to avoid disclosure of individual company data. |
| Release Date: 2/9/2022 |
| Next Release Date: Suspended |