|
Download Data (XLS File) |
|
|||||
|
|||||
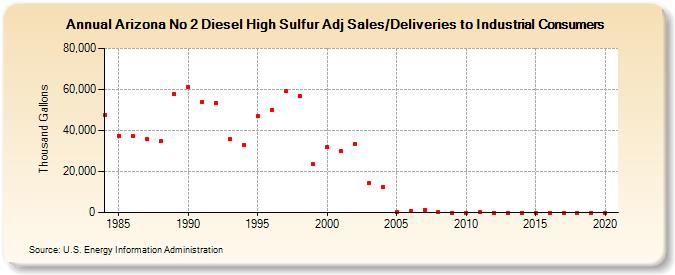
| Arizona No 2 Diesel High Sulfur Adj Sales/Deliveries to Industrial Consumers (Thousand Gallons) | |||||
| Decade | Year-0 | Year-1 | Year-2 | Year-3 | Year-4 | Year-5 | Year-6 | Year-7 | Year-8 | Year-9 |
|---|---|---|---|---|---|---|---|---|---|---|
| 1980's | 47,299 | 37,485 | 37,309 | 36,078 | 34,698 | 57,832 | ||||
| 1990's | 61,284 | 53,926 | 53,362 | 36,039 | 33,051 | 47,060 | 50,141 | 59,218 | 56,844 | 23,431 |
| 2000's | 31,741 | 29,769 | 33,525 | 14,186 | 12,411 | 433 | 706 | 1,387 | 212 | 0 |
| 2010's | 4 | 118 | 12 | 0 | 0 | 0 | 0 | 0 | 0 | 0 |
| 2020's | 0 |
| - = No Data Reported; -- = Not Applicable; NA = Not Available; W = Withheld to avoid disclosure of individual company data. |
| Release Date: 2/9/2022 |
| Next Release Date: Suspended |