|
Download Data (XLS File) |
|
|||||
|
|||||
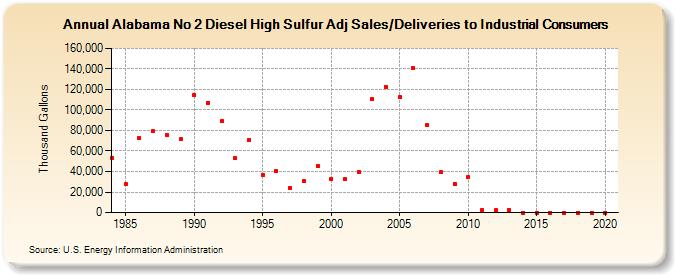
| Alabama No 2 Diesel High Sulfur Adj Sales/Deliveries to Industrial Consumers (Thousand Gallons) | |||||
| Decade | Year-0 | Year-1 | Year-2 | Year-3 | Year-4 | Year-5 | Year-6 | Year-7 | Year-8 | Year-9 |
|---|---|---|---|---|---|---|---|---|---|---|
| 1980's | 53,456 | 27,640 | 72,847 | 79,352 | 75,733 | 71,249 | ||||
| 1990's | 114,416 | 107,081 | 88,874 | 52,778 | 70,391 | 36,867 | 40,427 | 24,414 | 30,324 | 45,585 |
| 2000's | 32,264 | 32,321 | 39,814 | 110,534 | 122,457 | 112,303 | 141,043 | 85,181 | 39,382 | 28,262 |
| 2010's | 34,296 | 2,493 | 2,320 | 2,236 | 0 | 0 | 2 | 0 | 0 | 0 |
| 2020's | 0 |
| - = No Data Reported; -- = Not Applicable; NA = Not Available; W = Withheld to avoid disclosure of individual company data. |
| Release Date: 2/9/2022 |
| Next Release Date: Suspended |