|
Download Data (XLS File) |
|
|||||
|
|||||
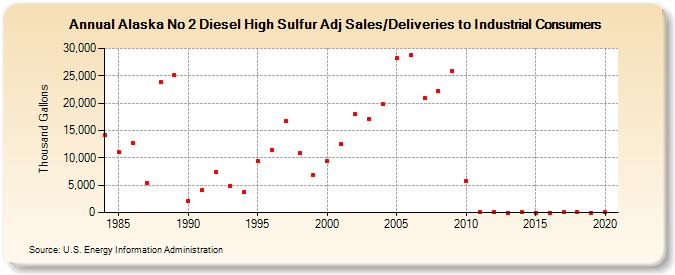
| Alaska No 2 Diesel High Sulfur Adj Sales/Deliveries to Industrial Consumers (Thousand Gallons) | |||||
| Decade | Year-0 | Year-1 | Year-2 | Year-3 | Year-4 | Year-5 | Year-6 | Year-7 | Year-8 | Year-9 |
|---|---|---|---|---|---|---|---|---|---|---|
| 1980's | 14,213 | 11,004 | 12,672 | 5,340 | 23,815 | 25,153 | ||||
| 1990's | 2,203 | 4,099 | 7,407 | 4,900 | 3,737 | 9,401 | 11,474 | 16,739 | 10,844 | 6,827 |
| 2000's | 9,389 | 12,573 | 17,992 | 17,182 | 19,795 | 28,154 | 28,779 | 20,911 | 22,284 | 25,851 |
| 2010's | 5,787 | 139 | 39 | 2 | 42 | 0 | 0 | 17 | 21 | 8 |
| 2020's | 24 |
| - = No Data Reported; -- = Not Applicable; NA = Not Available; W = Withheld to avoid disclosure of individual company data. |
| Release Date: 2/9/2022 |
| Next Release Date: Suspended |