|
Download Data (XLS File) |
|
|||||
|
|||||
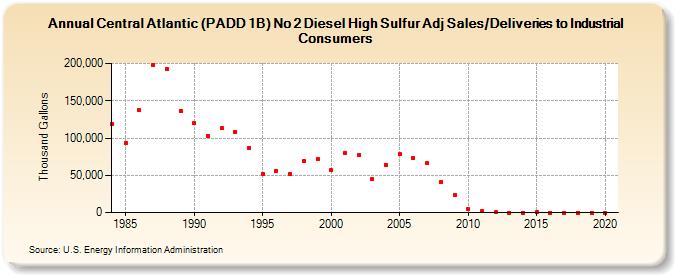
| Central Atlantic (PADD 1B) No 2 Diesel High Sulfur Adj Sales/Deliveries to Industrial Consumers (Thousand Gallons) | |||||
| Decade | Year-0 | Year-1 | Year-2 | Year-3 | Year-4 | Year-5 | Year-6 | Year-7 | Year-8 | Year-9 |
|---|---|---|---|---|---|---|---|---|---|---|
| 1980's | 118,293 | 93,570 | 137,163 | 198,523 | 193,013 | 136,872 | ||||
| 1990's | 120,048 | 103,301 | 113,116 | 108,728 | 86,812 | 52,181 | 56,231 | 51,240 | 69,162 | 71,906 |
| 2000's | 56,895 | 79,921 | 77,440 | 44,919 | 63,786 | 78,525 | 72,747 | 65,916 | 40,981 | 23,573 |
| 2010's | 4,907 | 1,936 | 346 | 56 | 0 | 86 | 0 | 0 | 0 | 0 |
| 2020's | 0 |
| - = No Data Reported; -- = Not Applicable; NA = Not Available; W = Withheld to avoid disclosure of individual company data. |
| Release Date: 2/9/2022 |
| Next Release Date: Suspended |