|
Download Data (XLS File) |
|
|||||
|
|||||
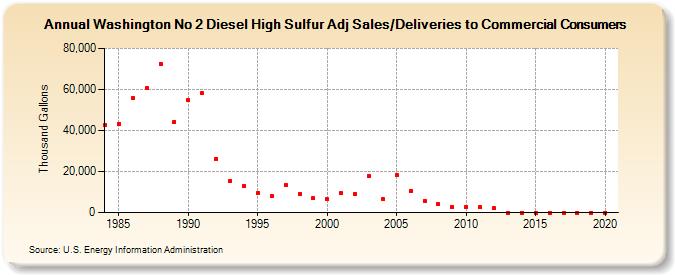
| Washington No 2 Diesel High Sulfur Adj Sales/Deliveries to Commercial Consumers (Thousand Gallons) | |||||
| Decade | Year-0 | Year-1 | Year-2 | Year-3 | Year-4 | Year-5 | Year-6 | Year-7 | Year-8 | Year-9 |
|---|---|---|---|---|---|---|---|---|---|---|
| 1980's | 42,814 | 43,305 | 55,800 | 60,617 | 72,559 | 44,294 | ||||
| 1990's | 54,651 | 58,161 | 26,322 | 15,263 | 12,838 | 9,681 | 7,988 | 13,500 | 9,286 | 6,914 |
| 2000's | 6,372 | 9,403 | 9,057 | 17,922 | 6,482 | 18,242 | 10,704 | 5,736 | 4,010 | 2,691 |
| 2010's | 2,748 | 2,582 | 1,996 | 0 | 0 | 0 | 0 | 0 | 0 | 0 |
| 2020's | 0 |
| - = No Data Reported; -- = Not Applicable; NA = Not Available; W = Withheld to avoid disclosure of individual company data. |
| Release Date: 2/9/2022 |
| Next Release Date: Suspended |