|
Download Data (XLS File) |
|
|||||
|
|||||
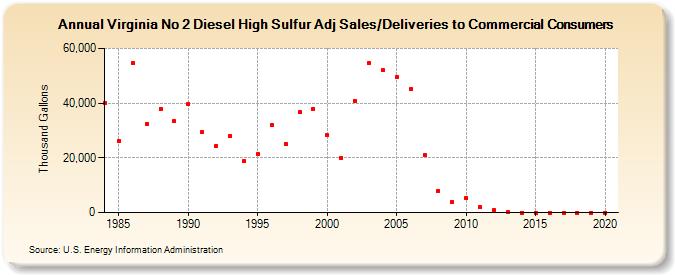
| Virginia No 2 Diesel High Sulfur Adj Sales/Deliveries to Commercial Consumers (Thousand Gallons) | |||||
| Decade | Year-0 | Year-1 | Year-2 | Year-3 | Year-4 | Year-5 | Year-6 | Year-7 | Year-8 | Year-9 |
|---|---|---|---|---|---|---|---|---|---|---|
| 1980's | 40,126 | 26,090 | 54,759 | 32,481 | 37,872 | 33,370 | ||||
| 1990's | 39,648 | 29,347 | 24,359 | 28,102 | 18,752 | 21,369 | 32,170 | 25,161 | 36,611 | 37,936 |
| 2000's | 28,281 | 20,061 | 40,903 | 54,705 | 52,044 | 49,624 | 44,996 | 21,050 | 7,954 | 3,771 |
| 2010's | 5,280 | 1,850 | 819 | 124 | 0 | 0 | 0 | 0 | 0 | 0 |
| 2020's | 0 |
| - = No Data Reported; -- = Not Applicable; NA = Not Available; W = Withheld to avoid disclosure of individual company data. |
| Release Date: 2/9/2022 |
| Next Release Date: Suspended |