|
Download Data (XLS File) |
|
|||||
|
|||||
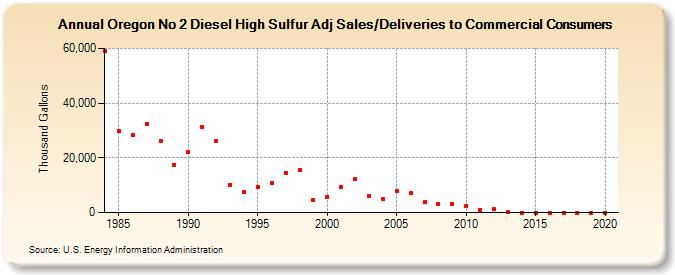
| Oregon No 2 Diesel High Sulfur Adj Sales/Deliveries to Commercial Consumers (Thousand Gallons) | |||||
| Decade | Year-0 | Year-1 | Year-2 | Year-3 | Year-4 | Year-5 | Year-6 | Year-7 | Year-8 | Year-9 |
|---|---|---|---|---|---|---|---|---|---|---|
| 1980's | 58,967 | 29,968 | 28,366 | 32,408 | 26,248 | 17,549 | ||||
| 1990's | 22,266 | 31,342 | 26,191 | 10,253 | 7,477 | 9,259 | 10,663 | 14,581 | 15,557 | 4,476 |
| 2000's | 5,734 | 9,416 | 12,194 | 6,165 | 4,954 | 7,749 | 7,022 | 3,837 | 3,212 | 3,026 |
| 2010's | 2,514 | 1,095 | 1,135 | 73 | 0 | 13 | 0 | 0 | 0 | 0 |
| 2020's | 0 |
| - = No Data Reported; -- = Not Applicable; NA = Not Available; W = Withheld to avoid disclosure of individual company data. |
| Release Date: 2/9/2022 |
| Next Release Date: Suspended |