|
Download Data (XLS File) |
|
|||||
|
|||||
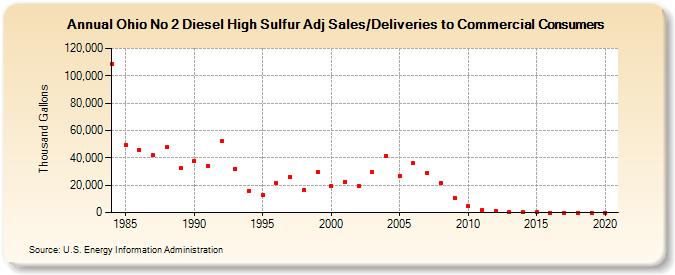
| Ohio No 2 Diesel High Sulfur Adj Sales/Deliveries to Commercial Consumers (Thousand Gallons) | |||||
| Decade | Year-0 | Year-1 | Year-2 | Year-3 | Year-4 | Year-5 | Year-6 | Year-7 | Year-8 | Year-9 |
|---|---|---|---|---|---|---|---|---|---|---|
| 1980's | 108,710 | 49,662 | 45,901 | 41,765 | 47,932 | 32,251 | ||||
| 1990's | 37,774 | 34,329 | 51,951 | 32,166 | 16,018 | 12,933 | 21,332 | 26,318 | 16,349 | 29,934 |
| 2000's | 19,318 | 22,553 | 19,319 | 29,298 | 41,651 | 26,917 | 36,061 | 28,972 | 21,670 | 10,558 |
| 2010's | 4,557 | 1,629 | 1,092 | 132 | 139 | 103 | 0 | 0 | 0 | 0 |
| 2020's | 0 |
| - = No Data Reported; -- = Not Applicable; NA = Not Available; W = Withheld to avoid disclosure of individual company data. |
| Release Date: 2/9/2022 |
| Next Release Date: Suspended |