|
Download Data (XLS File) |
|
|||||
|
|||||
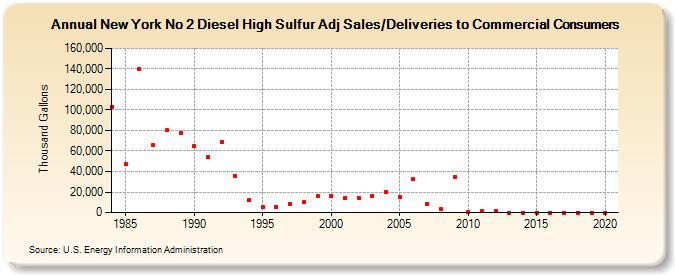
| New York No 2 Diesel High Sulfur Adj Sales/Deliveries to Commercial Consumers (Thousand Gallons) | |||||
| Decade | Year-0 | Year-1 | Year-2 | Year-3 | Year-4 | Year-5 | Year-6 | Year-7 | Year-8 | Year-9 |
|---|---|---|---|---|---|---|---|---|---|---|
| 1980's | 103,175 | 46,894 | 140,244 | 65,891 | 80,262 | 77,902 | ||||
| 1990's | 65,316 | 53,860 | 69,206 | 35,339 | 12,033 | 5,551 | 5,281 | 8,423 | 9,905 | 16,184 |
| 2000's | 16,016 | 14,535 | 14,673 | 16,094 | 20,164 | 15,580 | 32,356 | 8,528 | 3,039 | 35,063 |
| 2010's | 163 | 1,592 | 1,670 | 0 | 0 | 0 | 0 | 0 | 0 | 0 |
| 2020's | 0 |
| - = No Data Reported; -- = Not Applicable; NA = Not Available; W = Withheld to avoid disclosure of individual company data. |
| Release Date: 2/9/2022 |
| Next Release Date: Suspended |