|
Download Data (XLS File) |
|
|||||
|
|||||
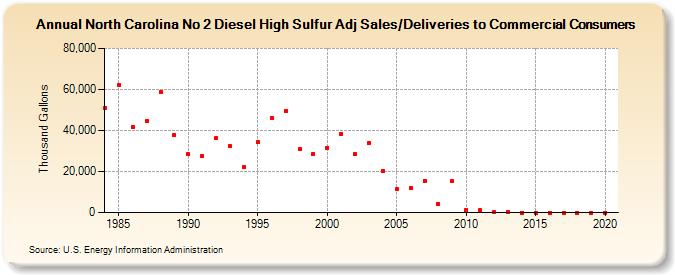
| North Carolina No 2 Diesel High Sulfur Adj Sales/Deliveries to Commercial Consumers (Thousand Gallons) | |||||
| Decade | Year-0 | Year-1 | Year-2 | Year-3 | Year-4 | Year-5 | Year-6 | Year-7 | Year-8 | Year-9 |
|---|---|---|---|---|---|---|---|---|---|---|
| 1980's | 51,002 | 61,967 | 41,672 | 44,401 | 58,860 | 37,838 | ||||
| 1990's | 28,519 | 27,467 | 36,413 | 32,359 | 22,023 | 34,320 | 46,128 | 49,707 | 30,914 | 28,764 |
| 2000's | 31,511 | 38,272 | 28,366 | 33,868 | 20,381 | 11,396 | 11,987 | 15,559 | 4,373 | 15,241 |
| 2010's | 1,489 | 1,177 | 293 | 276 | 0 | 0 | 0 | 0 | 0 | 0 |
| 2020's | 0 |
| - = No Data Reported; -- = Not Applicable; NA = Not Available; W = Withheld to avoid disclosure of individual company data. |
| Release Date: 2/9/2022 |
| Next Release Date: Suspended |