|
Download Data (XLS File) |
|
|||||
|
|||||
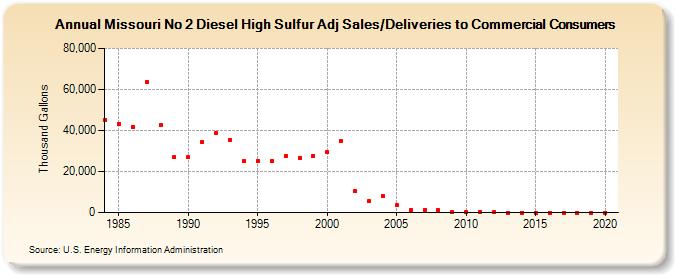
| Missouri No 2 Diesel High Sulfur Adj Sales/Deliveries to Commercial Consumers (Thousand Gallons) | |||||
| Decade | Year-0 | Year-1 | Year-2 | Year-3 | Year-4 | Year-5 | Year-6 | Year-7 | Year-8 | Year-9 |
|---|---|---|---|---|---|---|---|---|---|---|
| 1980's | 45,307 | 43,328 | 41,591 | 63,718 | 42,622 | 26,903 | ||||
| 1990's | 26,913 | 34,587 | 38,793 | 35,511 | 25,109 | 25,142 | 25,149 | 27,672 | 26,508 | 27,701 |
| 2000's | 29,405 | 34,963 | 10,277 | 5,500 | 7,874 | 3,554 | 1,018 | 1,258 | 1,095 | 236 |
| 2010's | 238 | 191 | 210 | 0 | 0 | 0 | 0 | 0 | 0 | 0 |
| 2020's | 0 |
| - = No Data Reported; -- = Not Applicable; NA = Not Available; W = Withheld to avoid disclosure of individual company data. |
| Release Date: 2/9/2022 |
| Next Release Date: Suspended |